 Taalk Help Center
Dashboard Overview
The Dashboard shows how your AI agents, campaigns and messages are performing, from live activity at the top to every call at the bottom.
Go to Dashboard. The same report, for one campaign, is at Outreach › Campaigns › open a campaign › Reporting.
AI agents and Operators
If you use Taalk Phone, a toggle at the top switches between two views:
| View | What it shows |
|---|---|
| AI agents | Your AI calls, texts and emails. This article covers this view. |
| Operators | Your human team: who's online, results and the operator call log. See Taalk Phone for Admins 6: Watching Your Team. |
Without Taalk Phone, you only see AI agents. Taalk remembers the view and date range you last used.
Layout, top to bottom
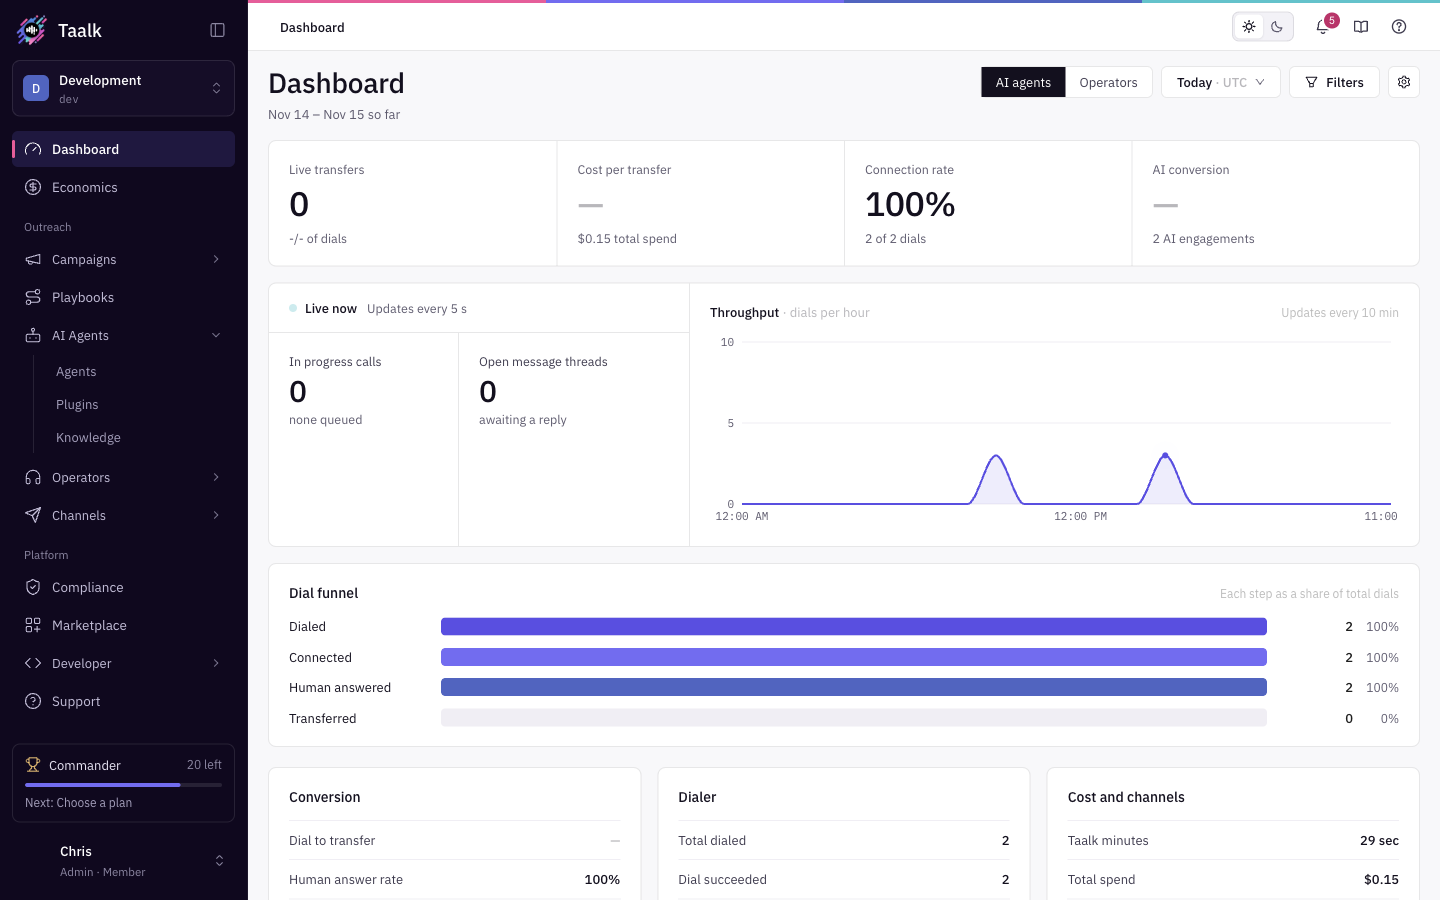 While you're setting up, the Get started checklist sits above the report.
- Header: the date range and what it's compared with, for example "Today so far · compared with yesterday". Filters and the gear are on the right.
- KPI strip: Live transfers, Cost per transfer, Connection rate and AI conversion.
- Live card: Live now, In progress calls (with how many are queued to dial), Open message threads, and the Throughput chart of dials over time.
- Dial funnel: Dialed, Connected, Human answered and Transferred, each as a share of total dials.
- Conversion, Dialer and Cost and channels cards.
- Custom outcomes (if Taalk support set any up for you), Transfer duration, and Spend and cost per transfer.
- Messaging Performance and Email Performance, when you sent texts or emails in the range.
- Top AI Agents, Top Campaigns and Agent Playbooks. Click an agent or campaign to filter the whole page to it.
- Post-Call Analysis, if you have the add-on.
- The call log.
Every tile is defined in the Metrics Glossary.
If nothing was dialed in the range, you see No calls in this date range with Show last 7 days and Go to campaigns.
Choose what's visible
- Click the gear next to Filters.
- Under Visible Sections, switch sections on or off.
- Click Save.
| Switch | Hides |
|---|---|
| Key Metrics | Conversion and Cost and channels cards, Spend and cost per transfer |
| Transfer Performance | Transfer duration card |
| Dialer Performance | Dial funnel and Dialer card |
| Messaging Performance | Messaging card |
| Email Performance | Email card (only listed when an email provider is connected) |
| Custom | Custom outcomes card (only listed when you have custom outcomes) |
| Postcall Analytics | Post-Call Analysis section (only listed with the add-on) |
The KPI strip, live card and call log always show. Your choice is saved for your login.
Date range
Click the date button in the header. Presets:
| Presets |
|---|
| Today, This Week, This Month, This Quarter |
| Last 7 Days, Last 14 Days, Last 30 Days |
| Last Week, Last Month, Last Quarter |
You can also pick any start and end date. Granularity at the bottom of the picker sets the chart intervals: Auto, Day, Week or Month. The button also shows the report timezone. The Dashboard opens on Today. Campaign › Reporting opens on the day the campaign was last active.
Filters
Click Filters. Changes apply right away, and the button shows how many are active.
| Filter | Narrows to |
|---|---|
| Contact Phone | One contact's number |
| Bot Phone | Calls on one or more of your numbers |
| Redirect Target | Calls transferred to a given target |
| AI Agent / Group | One or more agents or agent groups |
| Campaign | One or more campaigns (Dashboard only) |
On the Operators view the filters are Contact phone, Line and Operator.
Comparing with the previous period
When the range is a full week, month or year, or ends today, the header says what it's compared with. Counts in the cards (such as Total dialed, Answered calls or Total Messages Sent) show the change as a percentage, or flat. Hover the change to see the previous value. Rates, spend and the KPI strip don't show a change.
Live card
The live card is Live now while the range includes the current time and there's activity. Live counts update every 5 seconds. The rest of the report refreshes every 10 minutes. For a past range it reads Not live and Range ended.
Fingerprints
Under Transfer duration, the Messaging line counts texts and emails sent. Click Fingerprints (or Message Fingerprints / Email Fingerprints on the messaging cards) to open Engagement Fingerprints: every tracked link click in the range. See Short URL Tracking.
Call log
The call log at the bottom lists every call and message in the range. Click a bar segment in AI dispositions or AI time, a transfer band, or a clickable tile to filter it. See The Call Log.
What the Dashboard can't do (yet)
- Show dollar value or ROI. Those are on the Economics page. See Campaign Economics.
- Break numbers down per caller ID. Compare campaigns that use different numbers instead.
- Send alerts. Set those up per campaign in Campaign Alerts.
Troubleshooting
| Problem | Fix |
|---|---|
| A card is missing | Check the gear. Messaging and email cards only show when something was sent in the range. |
| No AI agents / Operators toggle | It appears once Taalk Phone is set up. |
| Numbers haven't updated | The report refreshes about every 10 minutes. Live card counts update every 5 seconds. |
| A number looks wrong | Check the definition in the Metrics Glossary, including "Things that may look off". |